Zebec’s price seems poised to confirm a breakout from a descending wedge pattern, potentially offering over 44% upside for the token.
Summary
- Zebec’s price has declined by 26% since its peak in August.
- Over 5 billion Zebec tokens have been staked within the network.
- ZBCN appears ready for a breakout from a downward wedge, with technical indicators looking favorable.
According to crypto.news, Zebec Network (ZBCN) is currently priced at $0.004, showing a 3.3% increase in the last 24 hours and a 7.7% growth over the past week. However, the token remains down 26% from its intraday high in August and 39% from its year-to-date peak.
The decline in Zebec’s price can be attributed to a selloff by early investors, along with decreasing interest and noticeably fewer community discussions since the peak excitement in May.
However, several recent developments could enhance the token’s performance in the coming weeks.
Firstly, Zebec has revealed a partnership with Turnkey, a provider of crypto wallet infrastructure, aiming to integrate embedded wallet APIs into major payroll systems. This could pave the way for broader crypto payroll adoption.
Additionally, the project has teased an upcoming collaboration with Asure Software, a cloud-based capital management firm based in Austin, Texas.
Such notable partnerships often rekindle community interest around the token, potentially attracting new investors to the project.
Moreover, the Zebec team has disclosed that over 5 billion ZBCN tokens have been staked, effectively reducing their circulation as more tokens are locked through staking.
If this trend of limited supply continues, it could apply upward pressure on the token’s price, especially if demand rises with increased ecosystem activity and strategic partnerships like the one with Turnkey.
On the daily chart, Zebec has been forming a falling wedge pattern since late July, a bullish reversal formation marked by consecutive lower highs and lower lows. The token is currently trading just below the upper trendline of the pattern, nearing a potential breakout.
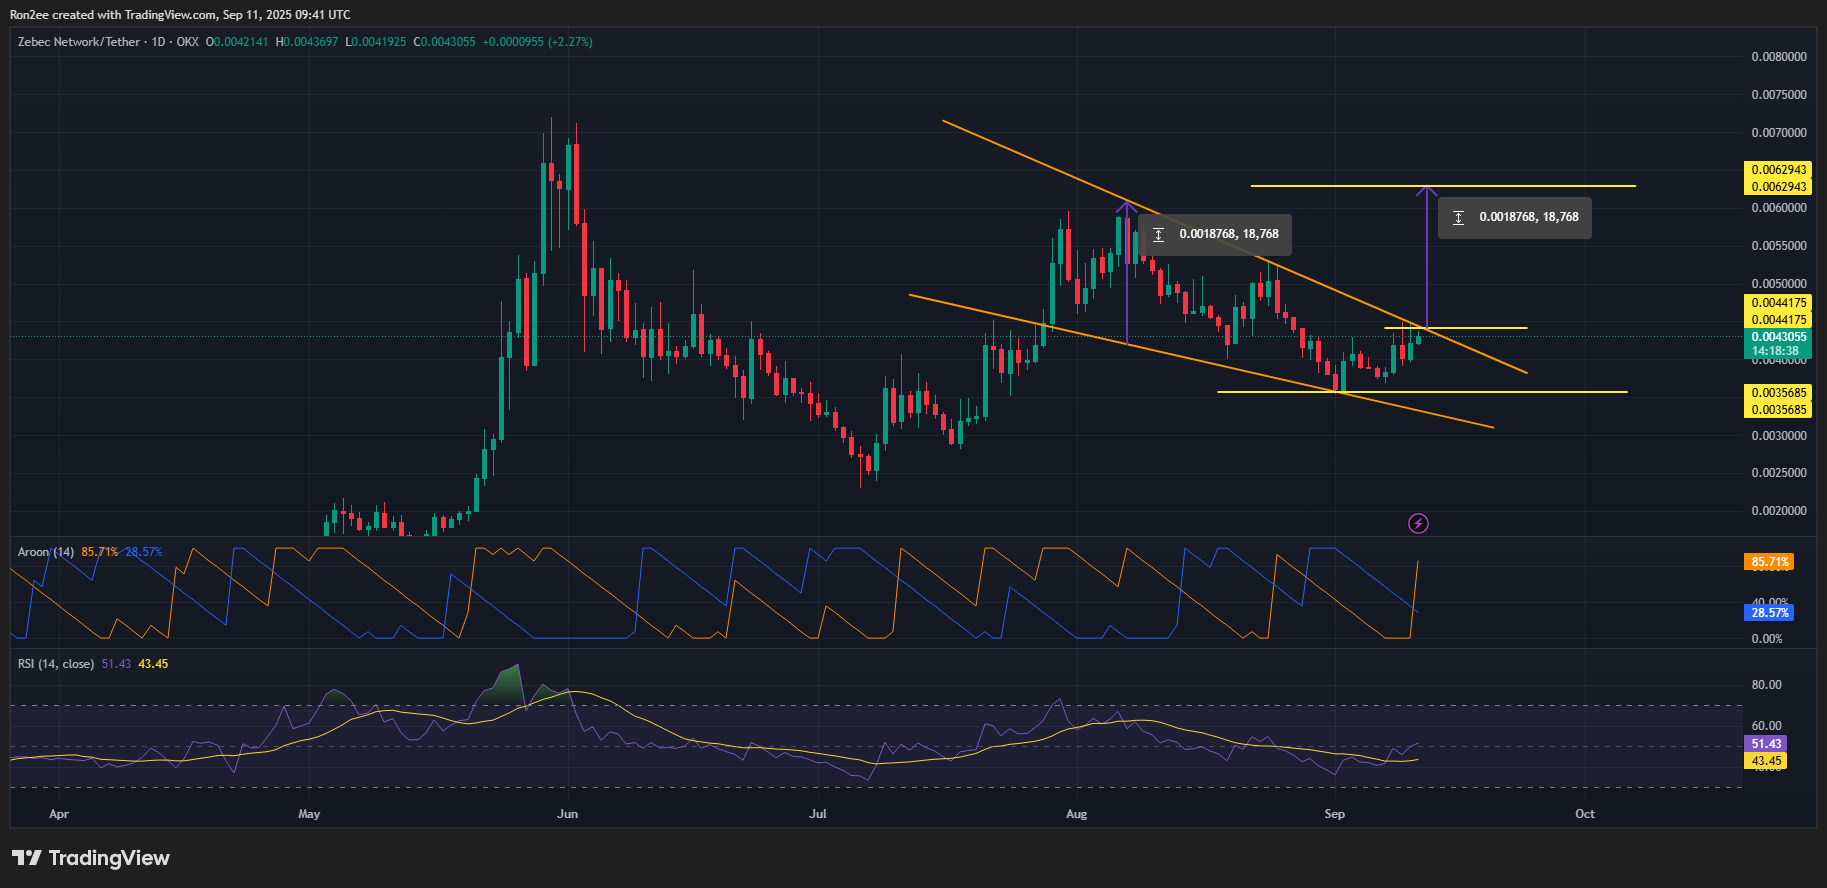
A confirmed breakout beyond this resistance would signal a shift in momentum, particularly as supportive indicators trend bullishly. Currently, the Aroon Up indicator stands at 85.7%, while the Aroon Down reads 28.57%, a combination typically viewed by traders as a buy signal, suggesting a strengthening uptrend.
The momentum is further corroborated by the Relative Strength Index, which has increased from a low of 35 to 51 in recent sessions. This gradual rise is generally seen as a strong indicator of increasing buying pressure, adding further credence to the optimistic outlook.
If the price decisively breaks above the wedge, ZBCN could rise towards the $0.0062 mark, representing an upside of around 44% from its current price.
On the other hand, a drop below the $0.0035 support level would invalidate the pattern and could lead to further declines, potentially revisiting the July low at $0.0023.
Disclosure: This article does not constitute investment advice. The content and materials presented on this page are for educational purposes only.